Home-Download-Recalibrate-Pre-process-Annotate1-Annotate2-Coregister-Statistics
Recalibrate
The function imzmlRecalFunction.m performs recalibration on a single file. It has various options to specify, and these are discussed below. The function called imzmlRecalBatch.m can be used for batch recalibration of a range of imzml files using the same settings.
imzmlRecalFunction.m
Summary
The basic aim of this function is determine the recalibrate required for each pixel of the image. To do this, it determines the ppm deviation of the specified reference peaks (at least 2) and uses the deviations from each pixel to recalibrate the m/z vector of each pixel.
Usage
Basic usage of the function is shown below. The function has 5 mandatory inputs: path, name, ions, ppm, type. Each of these must be specified for the function to operate. Inputs to this function are specified as 'name',value pairs so this function should always have an even number of inputs. In addition to the four mandatory pairs, there are additional arguments should you wish to experiment away from the default.
[x] = imzmlRecalFunction('path','/Folder/of/imzml/File/',...
            'name','NameOfFile.imzml',...
            'ions',[255.2330 885.5493],...
            'ppm',20,...
            'type','linear');
'path','/Folder/of/imzml/File/': specify the exact path of the imzml file, including the trailing slash. Note that with Windows you will need to use backslashes \ rather than the forward slashes / listed here. Incidentally the Matlab command filesep will provide the correct type of slash depending on your system.
'name','NameOfFile.imzml': the filename of the imzml file which is placed together with its .ibd file.
'ions',[255.2330 ... 885.5493]: specify a series of peaks which are known to be present in most pixels. 255 and 885 are commonly encountered in many DESI/MALDI samples of tissue, however ensure that your m/z range spans these two peaks. Change this default list if required, e.g. 411.3480 which may offer an alternative in some DESI samples.
'ppm',20: this parameter specifies the ± ppm tolerance for finding the peaks specified above. Each pixel of the image is searched for the specified ions ± ppm tolerance; the most intense signal within that range is considered to be the peak and its m/z value is used to generate the images and determine the extent of recalibration required. Setting it too small will result in missing the peak if its deviation exceeds the specified threshold. Conversely, setting it too small may result in selecting nothing. There are differences in how the DESI (profile mode) and MALDI (centroid mode) images need to be considered. Because the function finds the largest intensity, there is likely to always be such a peak in the profile mode DESI data. This may result in some ‘random’ peak being chosen to determine the recalibration offset. However, for the MALDI data which has been centroids, there is often no other signal within the tolerance except for the peak of interest. A tolerance of 20 ppm is reasonable for both.
'type','constant' (default) or 'linear' or 'poly' or 'lowess': this choice determines if any mathematical function is applied to the experimental ppm deviations. It is unlikely that all peaks are found within the tolerance in all pixels, and thus it would be impossible to recalibrate these pixels. So rather than ignoring or discarding these pixels, a mathematical function is used to model a fraction of the ppm deviations in order to return the results for pixels where peaks were missing. Note that the results of this function will be used to estimate the deviation of only the missing pixels; all other pixels will use their true ppm deviation (the exception is for 'constant' as explained below).
'constant'or'fixed': a single fixed value is applied to all pixels for each peak. The median value for peak deviations is applied uniformly to all pixels.'linear': a linear surface is fit to the ppm deviations for each of the reference ions, and the values from this are used to estimate the deviation of missing pixels.'poly': this fits a quadratic surface to the data. Please note that this can be extremely unpredictable at the edges of the image, and is seldom recommended.'lowess': locally estimated smoothing to determine a close fit to the data. It will struggle with a lot of missing data (especially at the edges) but has the advantage of tracking the shifts in ppm values much more closely than linear/poly because the shifts are seldom perfectly described by regular mathematical functions.
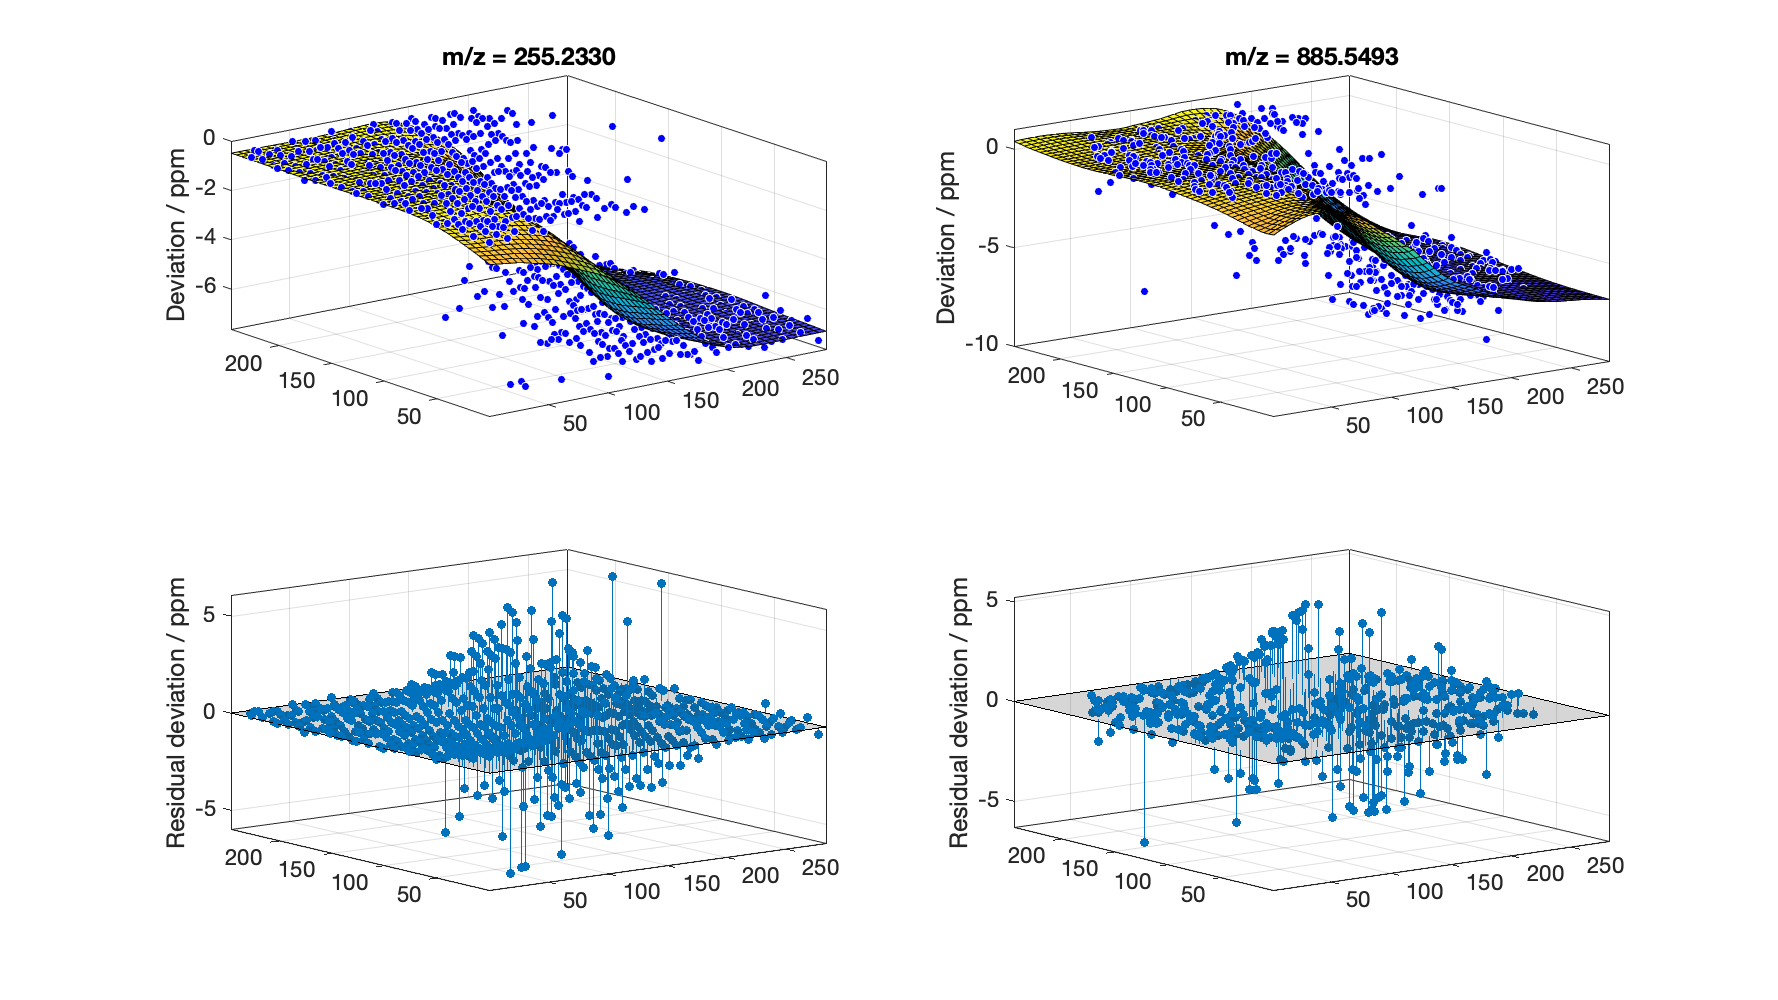 This figure shows the surfaces that are fitted to the raw ppm deviations for the two reference ions. In the top row, the raw data is represented by the scatter plots for image coordinates (x,y) and ppm deviation (z). In this instance, the lowess function was used to fit the surface to the subsampled data. The bottom row shows the residual plots, i.e. the difference between the raw values and the fitted surface. The deviations in individual pixels seldom conform to a regular mathematical function so large step changes may be observed. However, it should be stressed that the surface fitting is only used to estimate the deviation of missing pixels (except where
 'type','constant'). Other examples can be found in the figures folder of this repository.
(optional) 'samprate',100: not all of the pixels will be used to model the ppm deviation across the entire image. This is for time purposes, as lowess especially is extremely slow with a lot of data to fit. The default value of 100 means that 1 in 100 pixels will be used to determine the surface. Setting the value to 1 means that the deviations from all pixels will be used. Note that this value has no effect if the surface fit is 'constant'.
(optional) 'span',0.2: for 'lowess' surface fitting, it dictates the span of the smoothing window.
(optional) 'figure',false: for raw data used to determine the fitted surfaces, as well as the surfaces themselves. By default this is false.
Output
The result is a structure which contains all the data to recalibrate the files. You can visualise the results of recalibration using the following command:
[fig] = recalDiagnosticPlot(x);
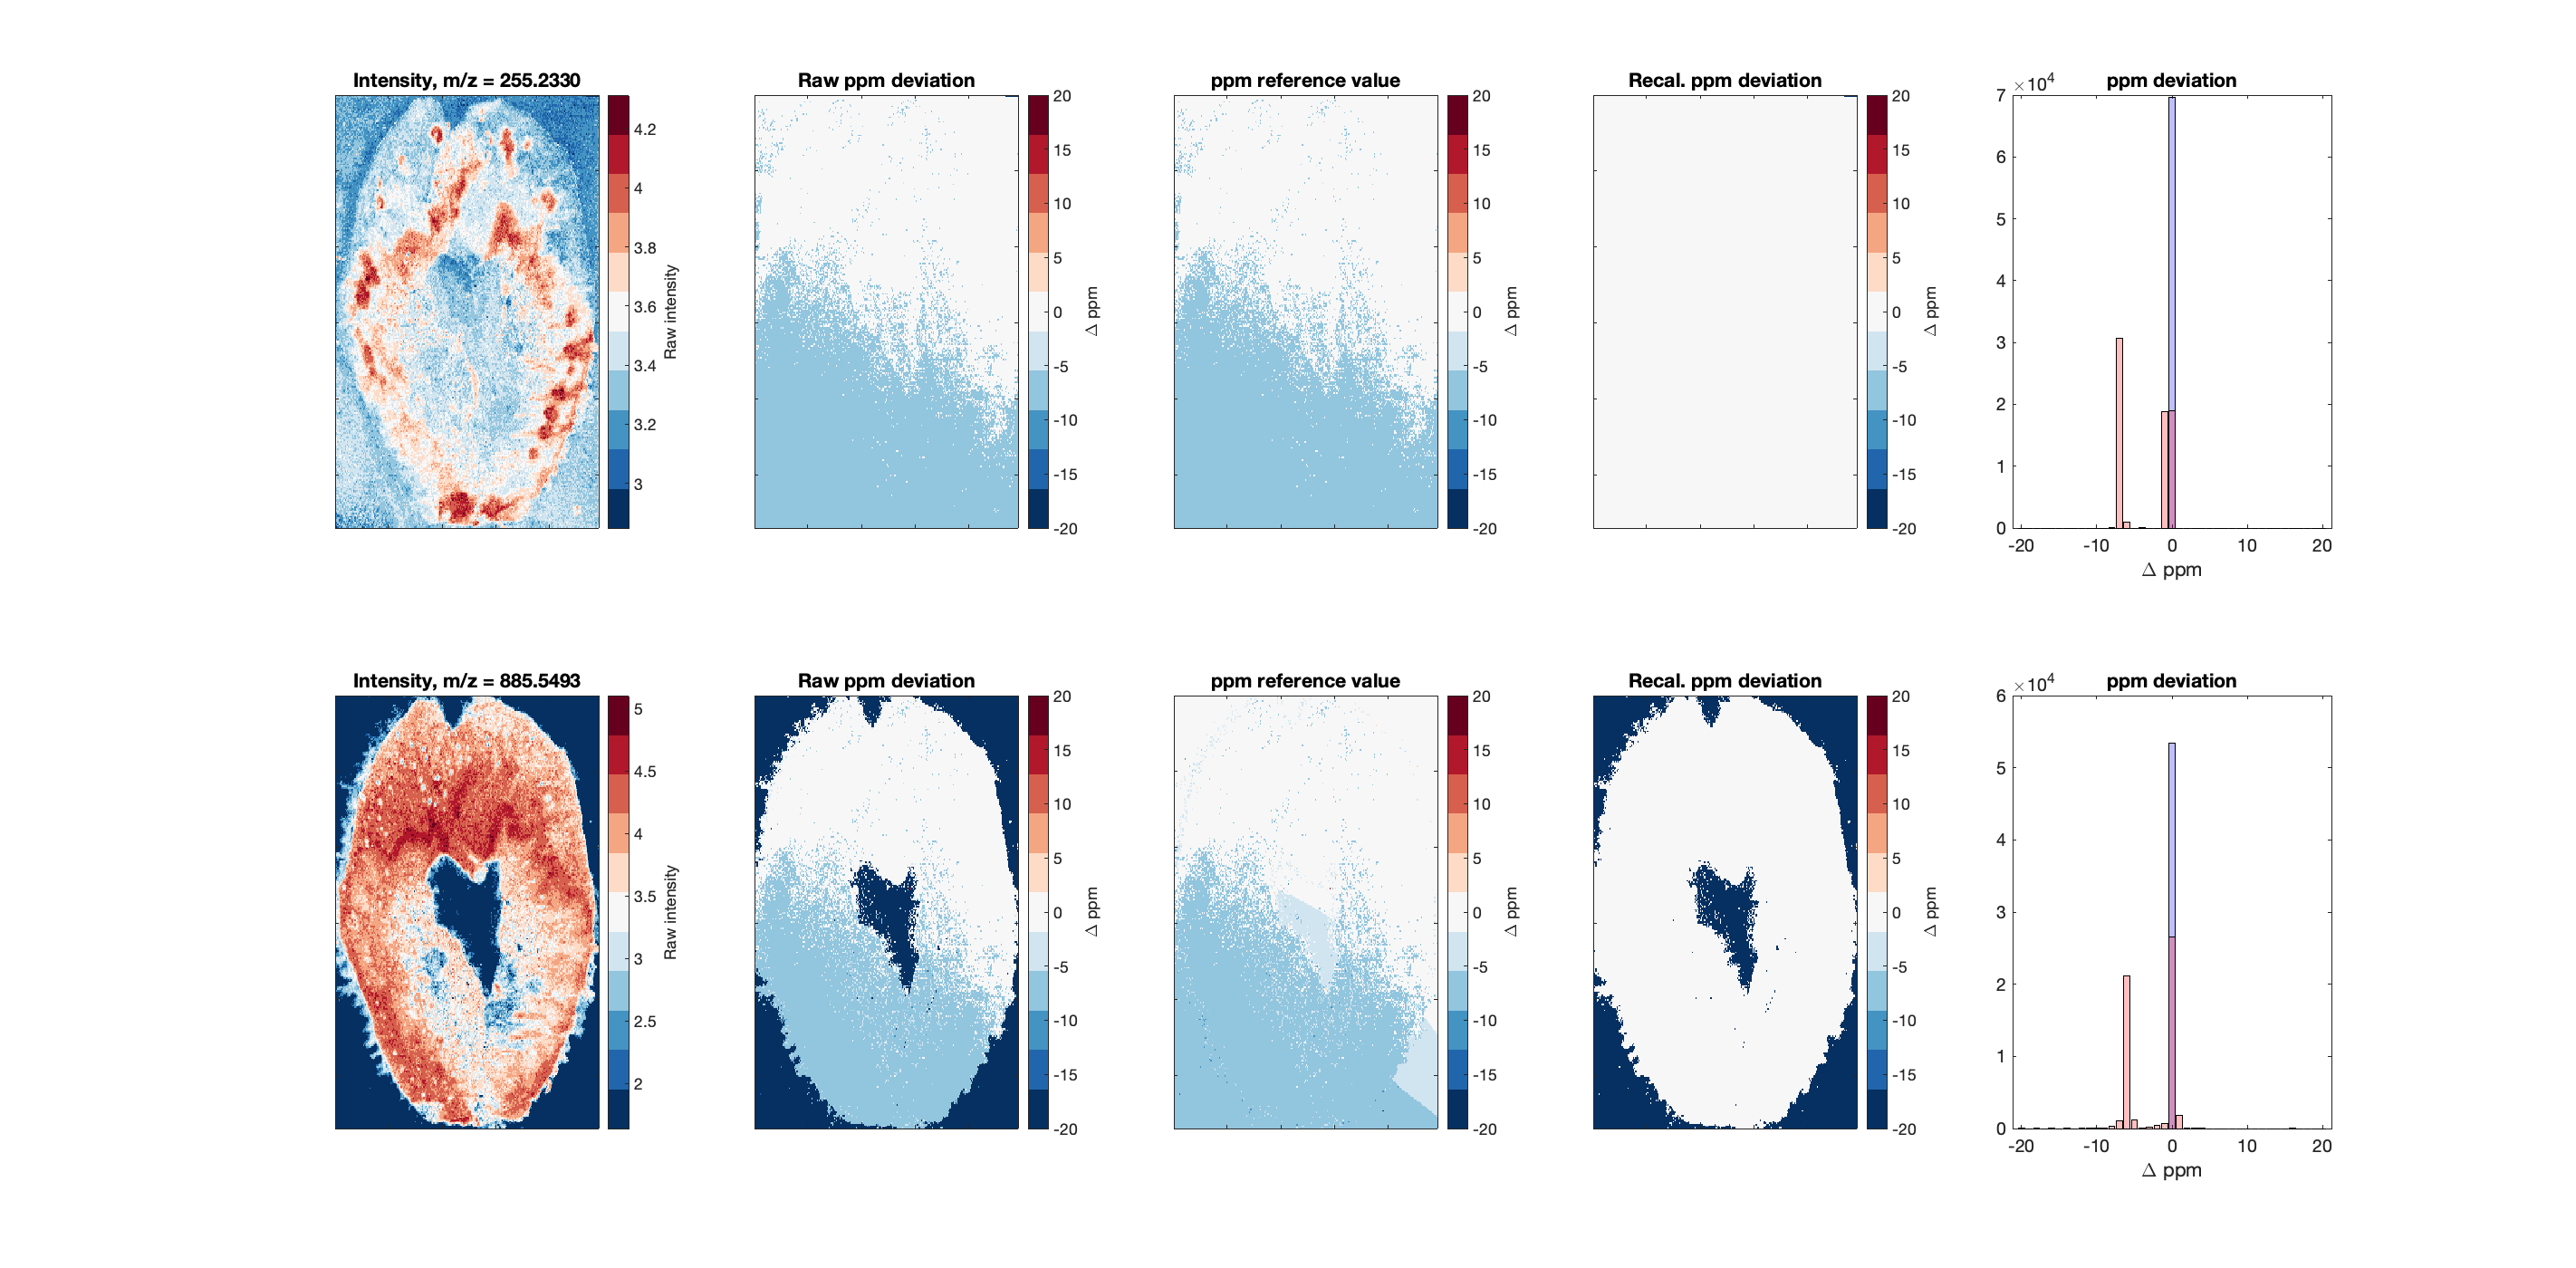 This figure shows a diagnostic plot from MALDI BCC 18 which has been recalibrated using a lowess smoothing function to estimate the ppm deviations of the missing pixels, which is only required for m/z = 885 as the lower m/z value is detected in every pixel. The first column shows the ion image for each of the two reference ions, and the second column is ppm deviation from the expected value. The third column uses the lowess smoothing to estimate the deviations of the missing pixels; note that where an m/z value is found for a specific pixel, this is the actual value used for recalibration. The fourth column shows the ppm deviation after the recalibration stage (the background pixels for m/z 885 are still missing, which is expected). And the final column shows the histograms of m/z values before (red) and after (blue) recalibration. Diagnostic images of other recalibration approaches can be found in the figures folder.
***
This figure shows a diagnostic plot from MALDI BCC 18 which has been recalibrated using a lowess smoothing function to estimate the ppm deviations of the missing pixels, which is only required for m/z = 885 as the lower m/z value is detected in every pixel. The first column shows the ion image for each of the two reference ions, and the second column is ppm deviation from the expected value. The third column uses the lowess smoothing to estimate the deviations of the missing pixels; note that where an m/z value is found for a specific pixel, this is the actual value used for recalibration. The fourth column shows the ppm deviation after the recalibration stage (the background pixels for m/z 885 are still missing, which is expected). And the final column shows the histograms of m/z values before (red) and after (blue) recalibration. Diagnostic images of other recalibration approaches can be found in the figures folder.
***
imzmlRecalBatch.m
This is a script that automates running the function described above. You will need to edit the paths and variables for DESI and MALDI processing, and can run this overnight to process a large amount of files.
Parameters
The various parameters are those that are described above, although not all options are invoked when calling the imzmlRecalFunction.
Scope
This function will work through all imzml files located within the path folder as specified. Each file is imported and recalibrated. The results are plotted in a figure, which is saved to the results folder. The results are saved here too, but the raw m/z and spectral intensities are removed from the structure to avoid re-saving the original data. What is preserved is the diagnostic information and the ppm values required for recalibrating the imzml file when it is next read in.
Summary
Running this function should generate a series of .mat files that contain the information required to perform recalibration during subsequent pre-processing stages.
Home-Download-Recalibrate-Pre-process-Annotate1-Annotate2-Coregister-Statistics